![]()
![]()
Coop média de Montréal
Journalisme indépendant
Can you support independent journalists with $5? donate today!
Behind the numbers, part II: The tuition fee hike may be worse than you think, plus corrections & updates
Blog posts reflect the views of their authors.

PHOTO: Mario Jean / MADOC http://printempsquebecois.com/
Last week I wrote a piece breaking down what I thought were some of the important terms and numbers that came out of the Quebec government's summit on higher education.
As the fog cleared from what was actually agreed to at the summit, I realized that some of what I wrote was incorrect--but not by much--and that in some ways what I wrote didn't go far enough.
Here again are some terms and numbers we should all be wary of in this new tuition fee hike.
Just a note though: these explanations are meant to shed some light on the numbers and words being used to justify the increase. They aren't meant to argue that if only the PQ was more honest with their numbers, or that if their language was more clear, we could have a kinder, gentler tuition fee increase. An increase is an increase no matter what. Perhaps even more importantly than breaking down the numbers is to break the tuition fee debate out of economics and into the realm of society: do we want accessible education for all, or do we want to gradually make it more and more inaccessible? If the answer is the former, then a freeze with a view to free education is the only route to follow.
That said...
Indexation or no Indexation?
In my last piece, I criticized outlets that were calling the proposed increase a "three per cent indexation." I wrote that an indexation is when a price is pegged to a particular indicator, which fluctuates, which it is. So if the increase was three per cent per year, then it's not an indexation. Turns out most journalists still worded it incorrectly--but from the other side. In fact, as the Journal Ensemble reported, it is a real and true indexation; it's the "three per cent" that's misleading. This means that while the yearly increase could be lower than three per cent, it could also be higher than three per cent. So while we can look to historical records to guess what the increase will be, we don't actually know.
Last time, I argued that indexation doesn't make sense; I still feel the same. An increase that fluctuates annually will make it particularly difficult for students, but also for schools, to plan for the following year's tuition fees; this will be even more so if you are planning for your whole studies, over several years, as will become clear below.
Where the "three per cent" comes from
Also last week, I questioned whether there would be a public accounting of where the three per cent average came from. As I demonstrated, if we take the data on average Quebec household disposable income from 1996 to 2010, the average yearly increase was only 1.36 per cent, or less than half of what was being proposed (again, you can see how I reached this number with this spreadsheet).
The next day, I read this post by economist Gérald Filion for Radio-Canada. In it, he explains that the average was taken from the annual increase in total disposable income of Quebeckers (which you get by taking the disposable income of every household and adding it up into one lump sum). Statistics Quebec makes that data available here. Thankfully, Fillion also does the math for us:
Annual total disposable household income in Quebec:
2007: 180,493 billion
2008: 188,701 billion
2009: 192,562 billion
2010: 197,531 billion
2011: 204,604 billion
The annual increase:
2008: +4,5 %
2009: +2,0 %
2010: +2,6 %
2011: +3,6 %
So, as Fillion points out, the increase is larger in years of economic growth and lower in years of recession. He also calculates that, based on these numbers, the increase (based on the 2012-2013 tuition fee rate of $2168) could range from $43 to $98, or more than doubling.
As he also points out, these increases actually average out to +3.3 per cent per year.
The distinction between calculating the annual change in average household disposable income and the annual change in total annual household disposable income is an important one, though.
As the researchers at IRIS have pointed out in a recent study, the after tax income of higher earning Quebeckers increases faster than those in lower pay brackets. By simply looking at the total annual income, the calculation doesn't take into account that the average household income may not be increasing at the same rate as the total amount (ie, the pie is getting bigger, but not everyone's getting a bigger slice).
For example, if we take a comparable part of the numbers available for average household income--2007 to 2010--the average annual increase was only 0.63 per cent. The average annual increase in overall disposable income? Three per cent. So why use this statistic?
I don't call economist Pierre Fortin's numbers into question, but again: the PQ picked three statistics to choose from, and then managed chose the one in middle. Could it be that average household disposable income just didn't fit in their pre-selected spectrum of choices?
One could also ask why such a small sample size was used. Clearly we'd have a better predictor of the average increase if we were basing it off of 10 or 15 years worth of data.
70$ per year - but how much will that degree cost you?
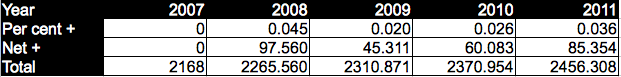
As Fillion established, the $70 per year is misleading, because it could fluctuate widely. Below is a table of what the increases would have been if the PQ's policies had been in effect from 2007 until 2011.
Further, if we take the 3.3 per cent average, the table I presented last time would instead look like this:
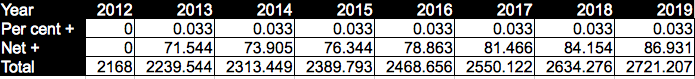
So, slightly higher than before. And students in 2019 (seven years) will be paying 26 per cent more per year for their schooling.
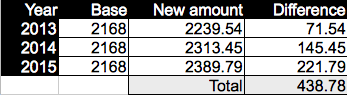
But what I didn't consider was what the cumulative increase would be. So, for example, a student starting a three year bachelors degree next year would be paying three years worth of hikes. Their degree will therefore cost them $438.78 more:
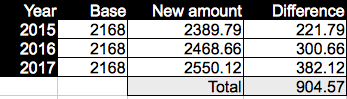
A student starting a two year CEGEP program next fall? By the time they are done a three year bachelor's degree, they will pay over $900 more for their degree:
And what if someone finished their degree in 2019, the same year the Charest Liberals' seven year increase would have ended?
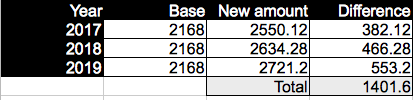
They will have paid $1400 more than if the freeze was still in place.
The argument has been made by the PQ that these increases will be off-set by increased financial aid. But with so many promises reneged on so far, until the details are on paper, I would be skeptical that they have anything planned that would drastically change the situation.
Tonight, students and supporters are again taking to the streets of Montreal to protest this increase, in the first night demo since last fall. It isn't clear if the momentum is there for another spring like 2012, people are exhausted and frustrated, and a student strike can take years to build. But with the PQ's reneging on eliminating the health care tax, and the recent announcement of drastic welfare cuts, there will be plenty of reasons for people to take the streets over the coming months. And hey, with a perpetual tuition fee hike, it's not like it's going anywhere.


About the poster

1177 words
The site for the Montreal local of The Media Co-op has been archived and will no longer be updated. Please visit the main Media Co-op website to learn more about the organization.